Built for the field, feature by feature.
Every lead, deal, and dollar your reps generate — captured live and rolled into one view.
Every one of these earned its place running a real 30+ rep operation — not a roadmap.
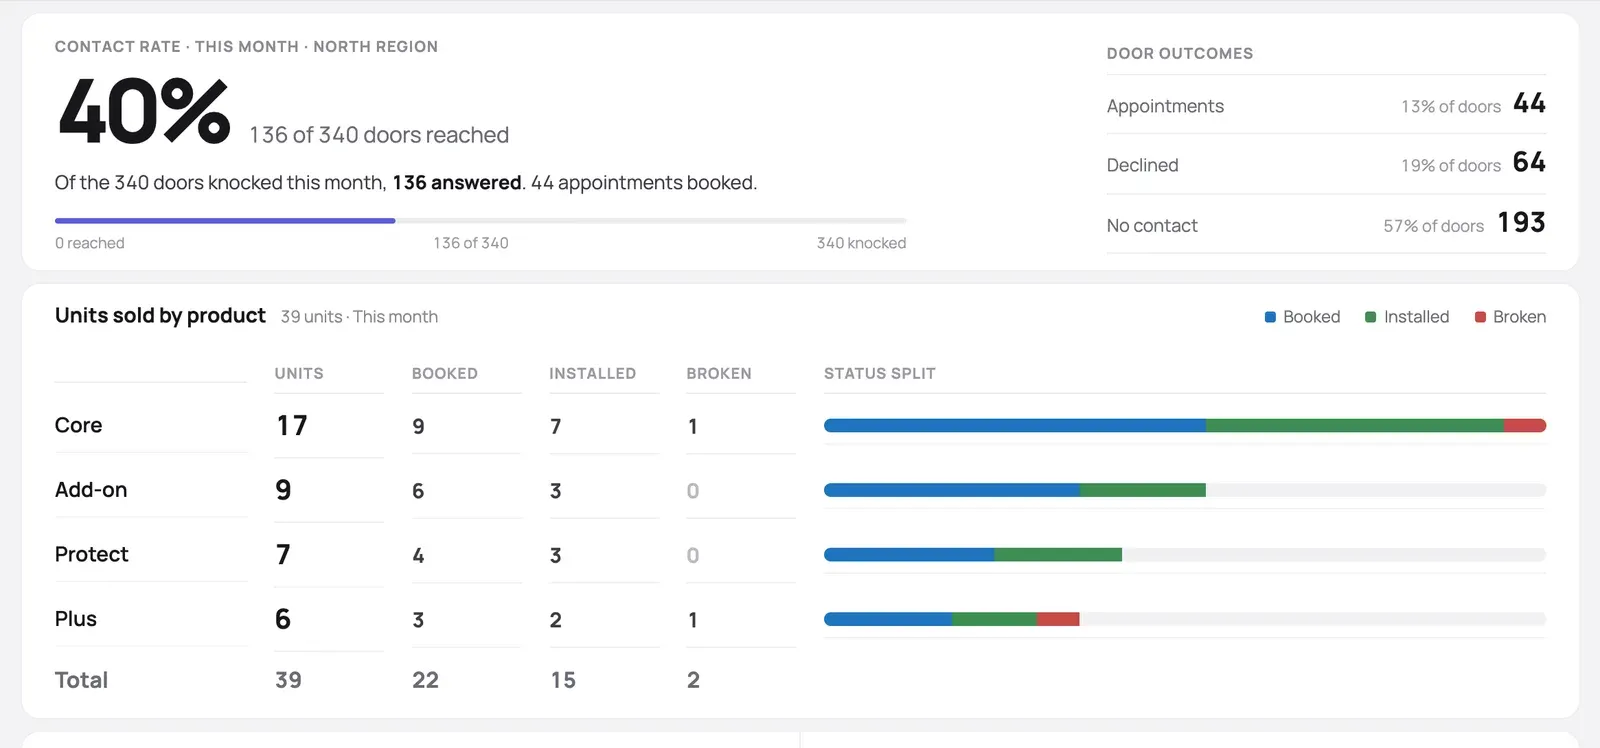
Live dashboard
Week pace against target, door activity, units by product, and the deals landing — in one glance, updating as reps work.
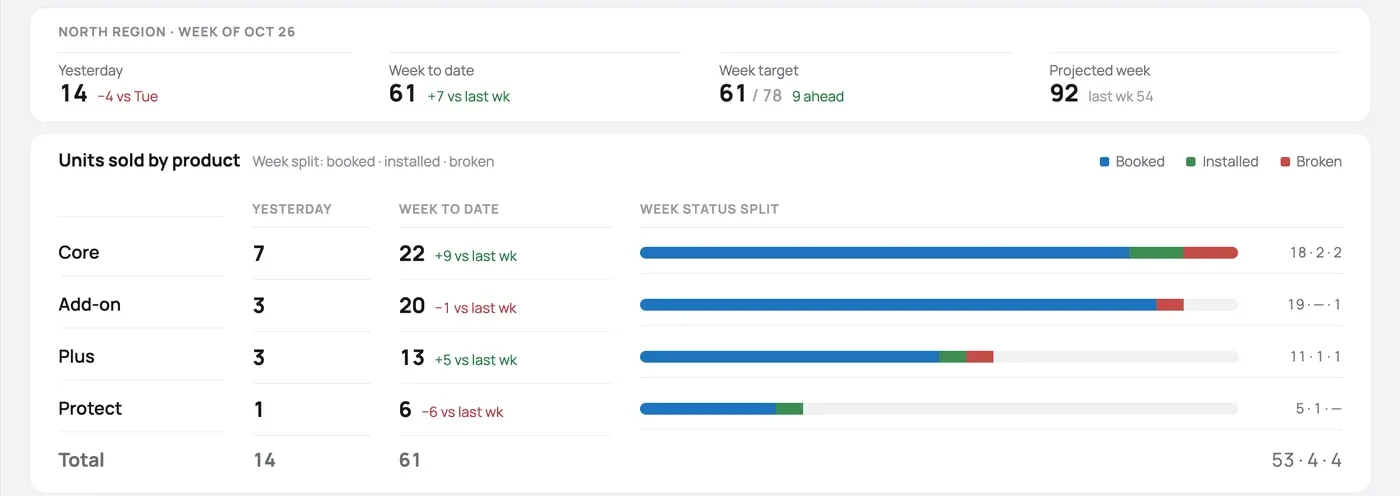
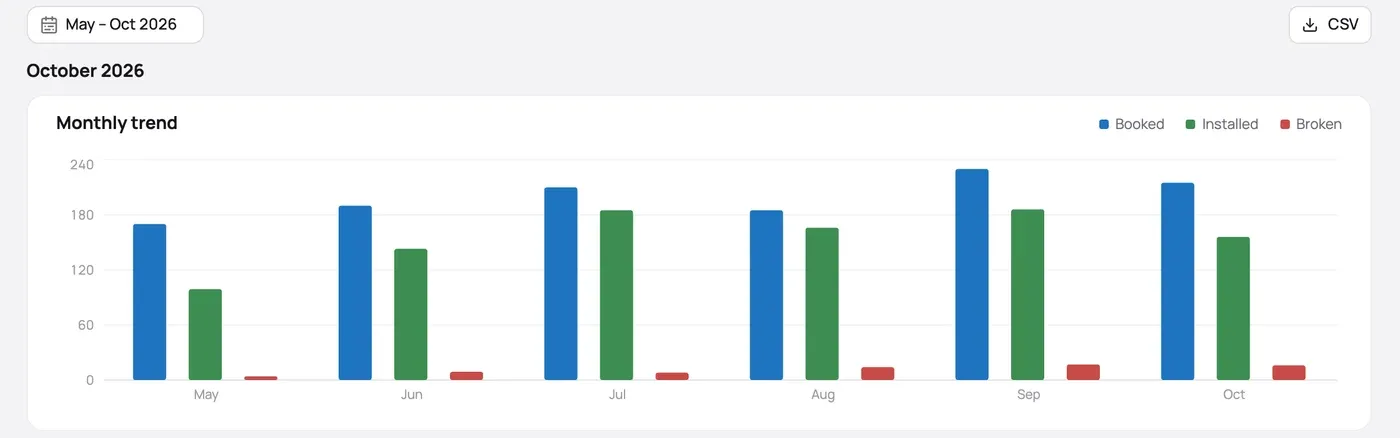
Trends and exports
Six months of booked, installed, and broken side by side — pick any date range, break it down by week and product, and take the whole thing out as CSV.
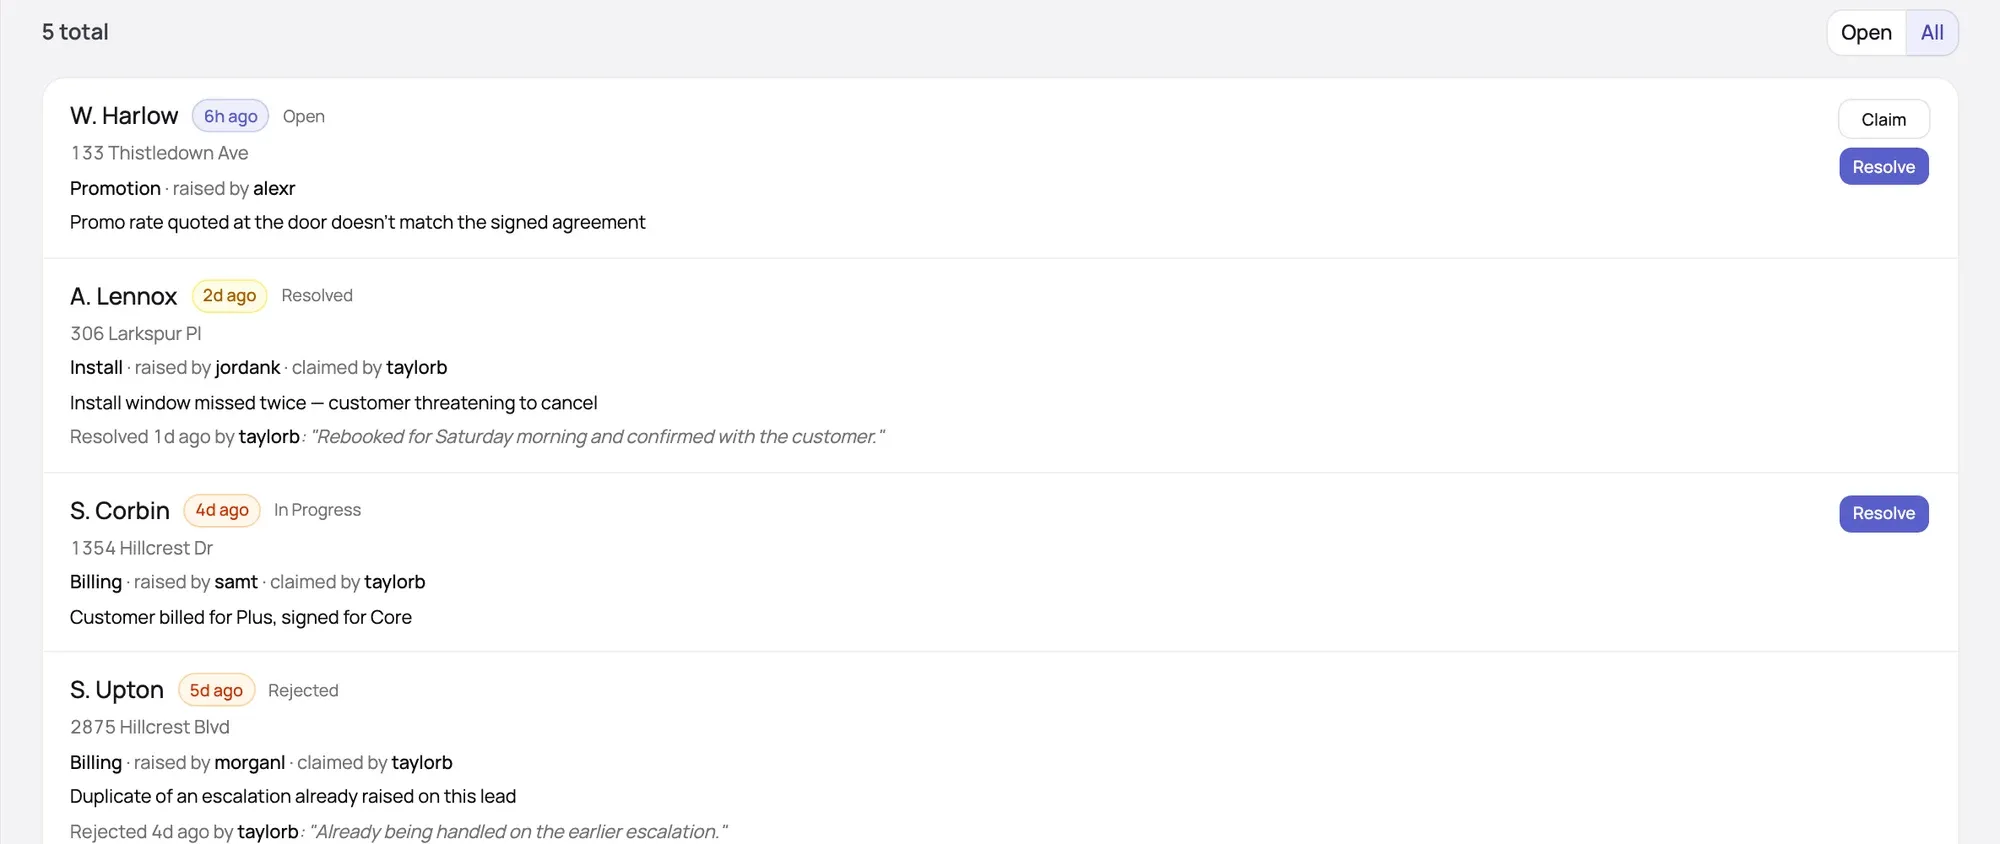
Escalations
A missed install window, a billing mismatch, a credit check that landed late — a rep raises it from the lead itself. It queues up for a manager to claim, then gets resolved or rejected with a note the rep can read. Anything still sitting after a week turns red.
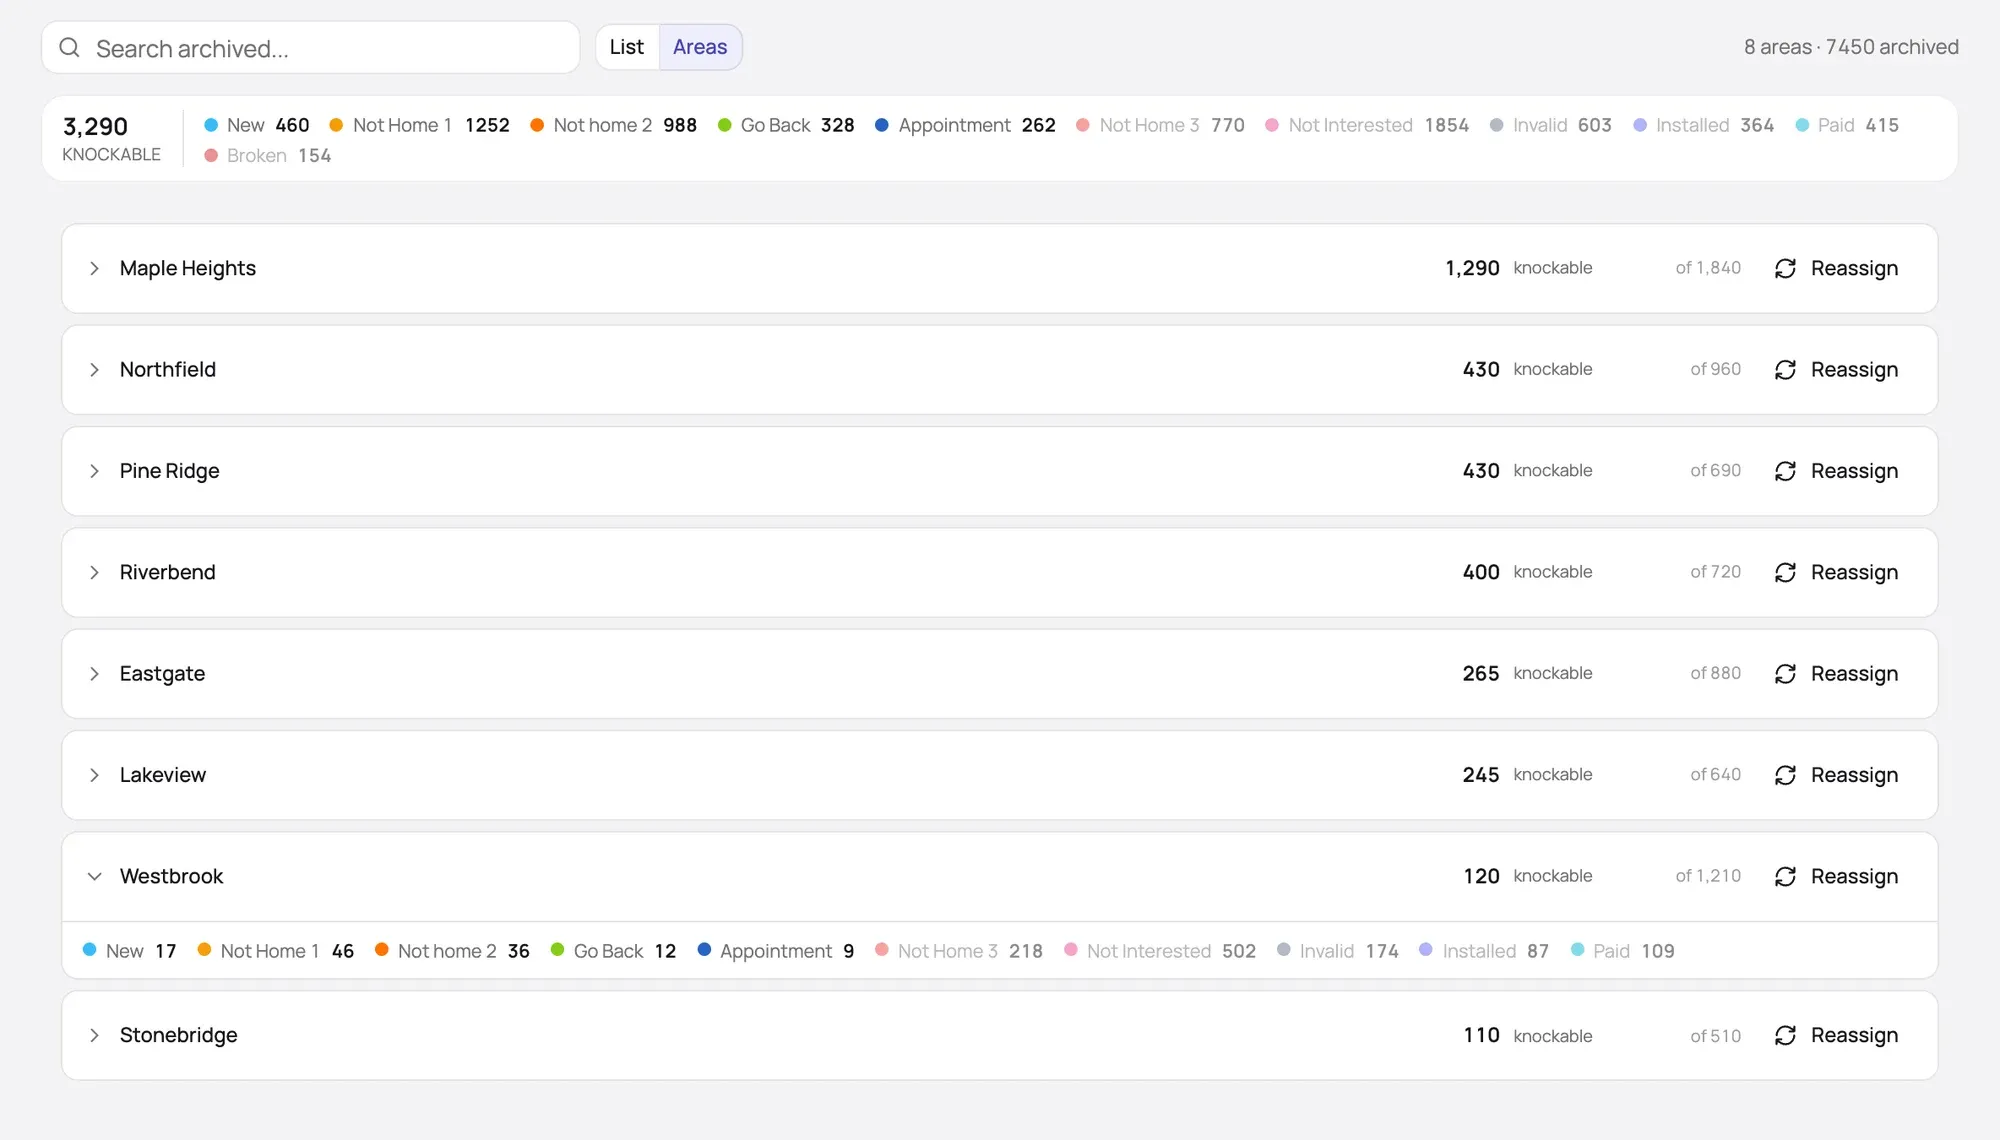
The doors you have already knocked
Every archived lead stays searchable, grouped by area and ordered by how many are still worth a second knock. Canvast separates the archive from the opportunity — a customer who paid is not a door — so you can see which areas are worked out and which still have hundreds left. Hand an area’s knockable leads back to a rep in one go, and the customers stay where they are.
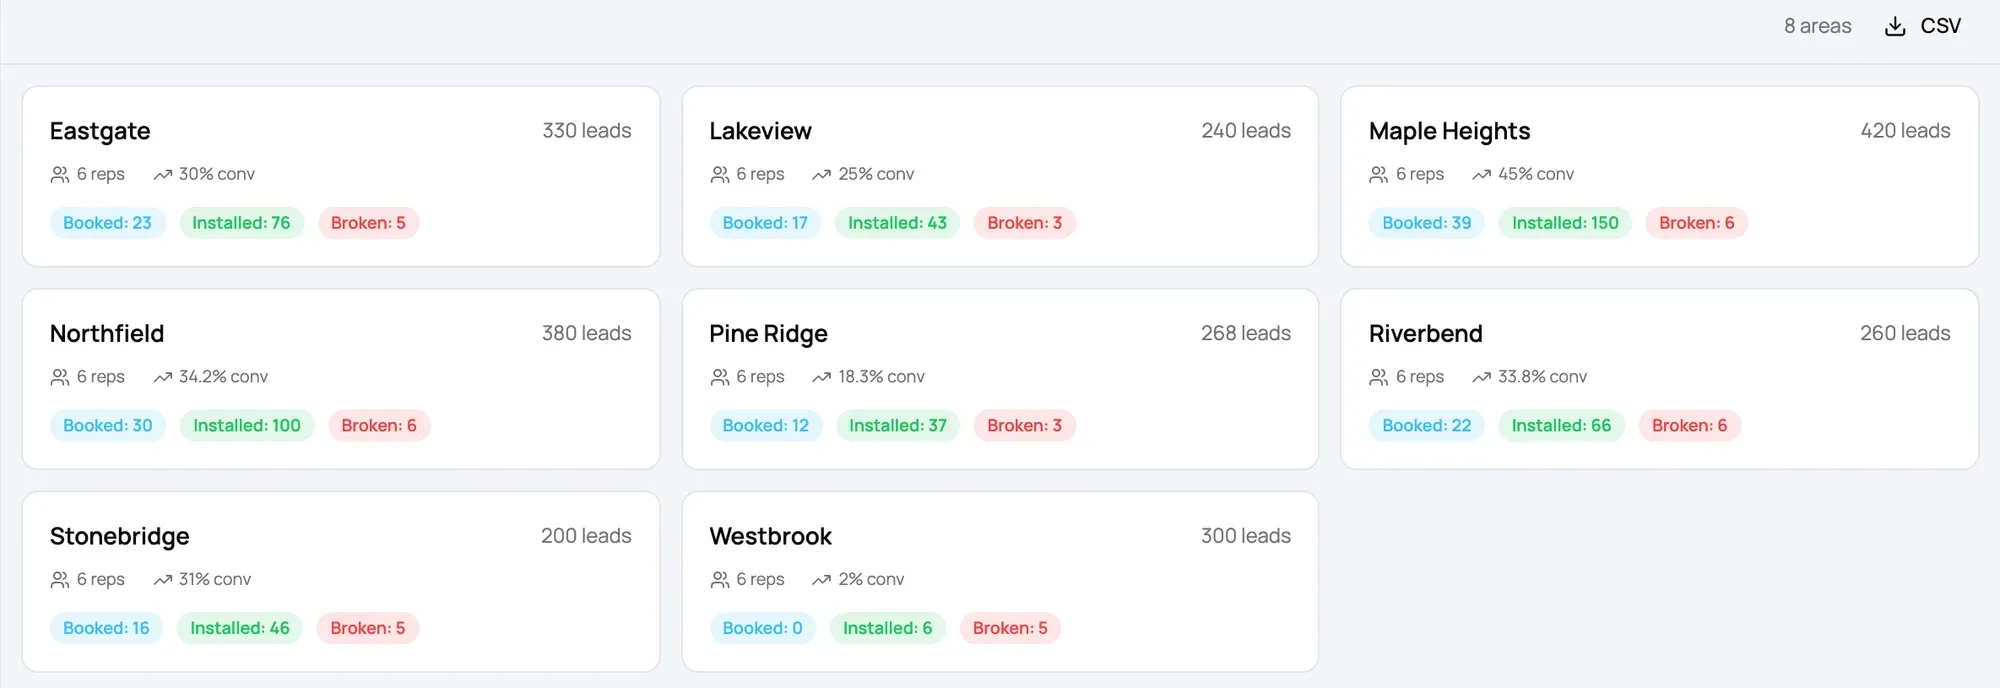
Coverage by town
Every lead grouped by the town it sits in, and what each one actually gave back — doors knocked, reps on the ground, and the share that converted. Same number of reps in each. The return is not the same.
Multi-region rollups
Run one region or all of them in a single view — drill from company-wide down to a single rep’s day.